Interactive dashboard
Release Date: February 10, 2025
We are excited to announce a major new improvement to Simple Timesheet: the introduction of an interactive dashboard. This feature is designed to provide SME managers and project managers with a clear, real-time view of time tracking data, facilitating informed decision making and optimizing team management.
Why an interactive dashboard?
In the current SME environment, the ability to quickly analyze time data is essential for effective project and human resource management. An interactive dashboard centralizes this information, allowing managers to visualize trends, identify gaps and proactively respond to operational challenges.
What are the benefits for SME managers and project leaders?
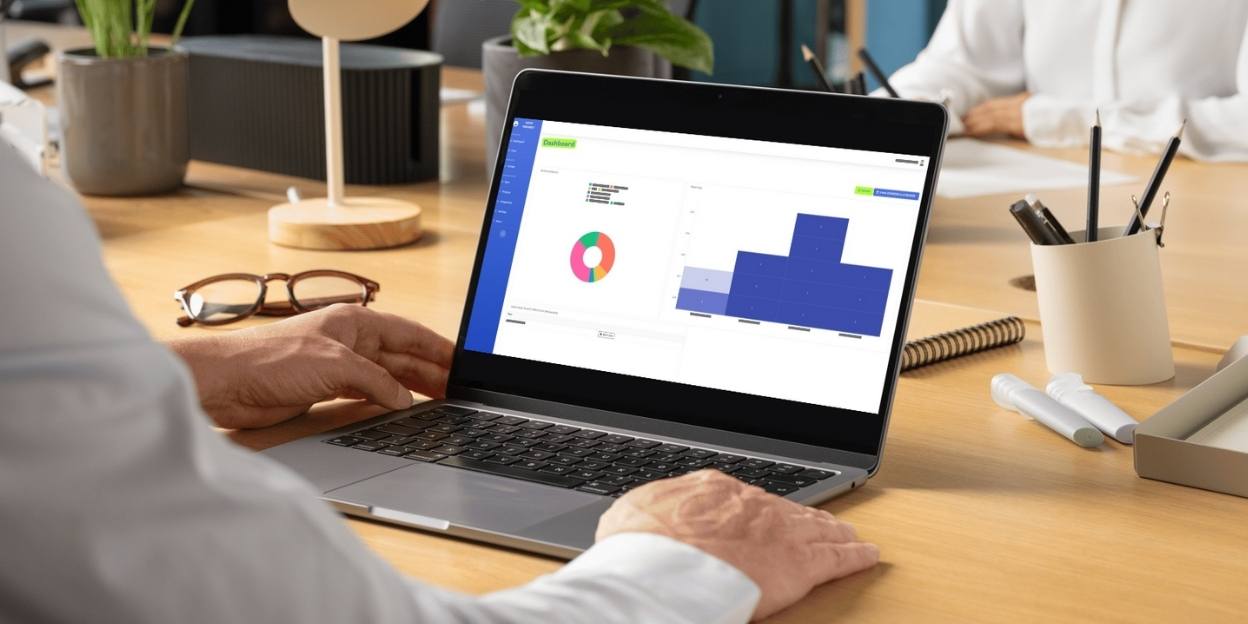
1. An overview of active projects
The new Simple Timesheet dashboard provides a clear view of ongoing projects. A coloured pie chart shows time allocation. A detailed legend helps identify tasks at a glance. This feature allows managers to analyze resource distribution more accurately. It also helps identify priority projects and maintain a balanced workload.
2. A heatmap for tracking hours worked
The dashboard includes a dynamic heatmap to visualize hours worked per employee. Darker hues indicate higher work volumes. This allows for a quick and intuitive analysis of trends. The feature helps identify underutilized or overworked employees instantly. Managers can then adjust schedules to optimize productivity. It also ensures a more balanced distribution of tasks.
3. Tracking of unfilled time sheets
Tracking unfilled time slips is a major challenge in time management. Simple Timesheet now includes a section listing users who missed submissions. An alert button allows managers to send reminders with one click. This tool reduces omissions and ensures accurate hour tracking. It also improves data reliability.
4. A date range selector and real-time refresh
Quick access to the right data is essential for time management. The dashboard includes a date range selector for filtering displayed data. This option helps analyze weekly, monthly, or annual trends. It also makes it easier to compare workload variations. A “Refresh” button allows real-time updates of statistics. This ensures managers have an up-to-date view of productivity.
Conclusion
The interactive dashboard in Simple Timesheet is a major step forward. It helps SMEs improve time management and team efficiency. We encourage you to explore this new feature. See how it can benefit your organization.
Before the interactive dashboard, we introduced another major improvement: the integration of Teams notifications. See how it makes time management easier : Release Notes – Version 1.2.0